Project management is nearly impossible without data. Fortunately, Agile software development standardizes the process with story points, making it easier to estimate difficulty and measure progress. Using these standardized metrics, key performance indicators, or KPIs, enable data-driven decisions and make it easier to keep projects on track.
Let's look at three development-focused key performance indicators that every team leader should know and use.
KPIs are essential tools to help development teams keep projects on track and solve any challenges that arise. Share on XWhy KPIs Matter
The Agile methodology stresses the importance of individuals and interactions over processes. Rather than planning everything upfront, Agile teams prefer collaborative and incremental development. But, of course, the free-form nature of Agile development makes it harder to track progress and ensure everything stays on track.
Scrum helps organize these efforts by implementing the principles of Agile as a concrete set of artifacts, practices, and roles. For instance, scrum teams build a Roadmap with prioritized product backlog and divide projects into sprints. After each sprint, the team demonstrates their accomplishments to stakeholders and reflects on what they did well and not so well.
These concrete processes create the groundwork for key performance indicators (KPIs) that can deliver insight into team productivity, customer satisfaction, and a broad range of other concerns for software businesses. In particular, breaking down a project into sprints can help provide keen insights into how well teams perform over time.
#1. Burndown Charts
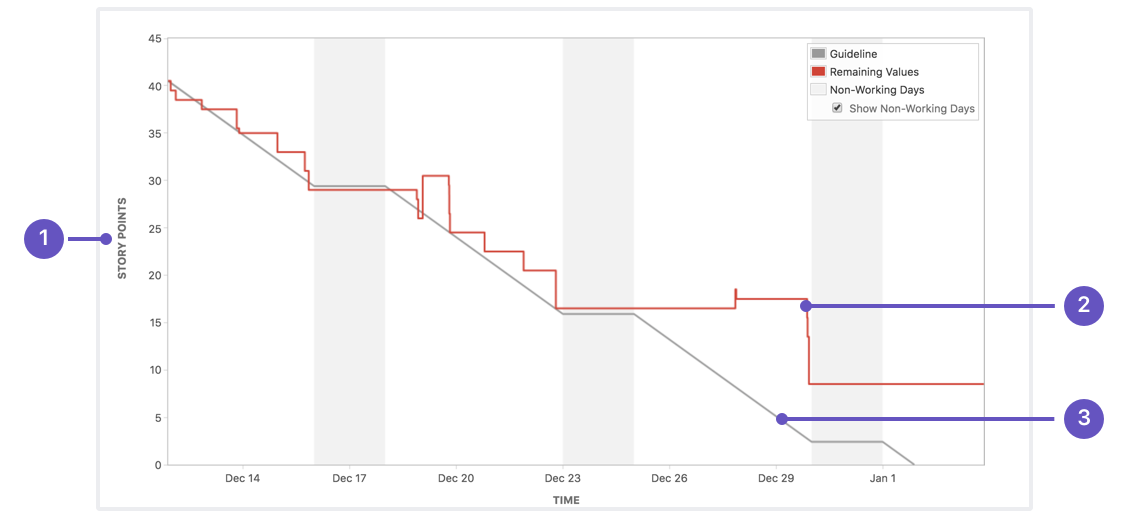
Burndown charts are graphs showing the amount of work remaining over time. The Y-axis (vertical) typically represents the remaining story points, while the X-axis (horizontal) represents a sprint. Most Agile development platforms, such as Jira, provide built-in burndown charts, enabling project managers to quickly assess if a sprint is on track.

Jira's burndown charts show progress over time. Source: Atlassian
Burndown charts don't convey a tremendous amount of information, but they make it painfully obvious when the team is off-track. As a result, it's an excellent way to encourage and motivate the team to track their progress and address any challenges. Retrospectives may also be helpful when a sprint burndown chart misses the target.
#2. Development Velocity
Development velocity is the number of story points finished during a single sprint. Or, in other words, it's the slope of the burndown chart or the rate that the team completes story points. While it seems like a natural KPI, velocity can be a misleading statistic due to the time it takes to get into the groove of a new project and other unique factors.
Team leaders should reject early development velocity readings as the team acclimates to a new project. Once velocity metrics stabilize, the best approach is typically to let the team set their own velocity goals with the expectation that they will gradually increase over time. It's also important to avoid comparing velocity metrics between different groups.
#3. Lead or Cycle Time
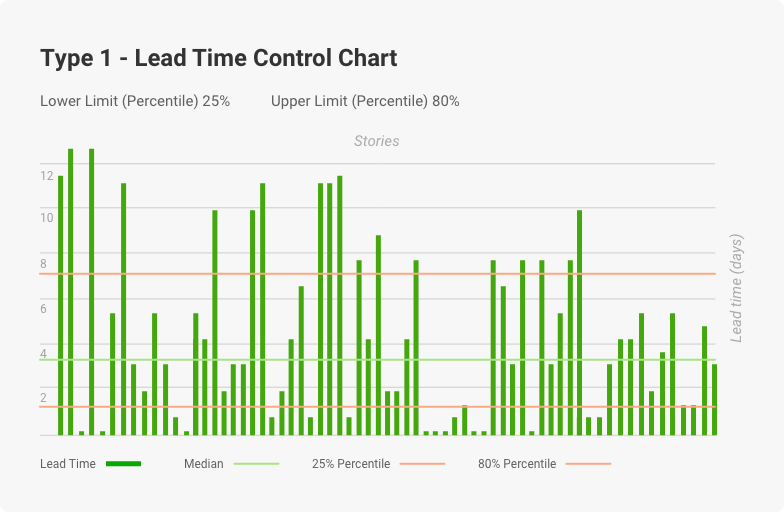
Lead time shows how long it takes for an entire team to turn an idea into an actual product, while cycle time represents the time it takes for developers to finish their part. While lead times may start high with new teams or projects, they should fall over time as the team learns to work better together and gets into the groove of a project.

The lead time chart shows the number of days to deploy each story. Source: KeyUA
Lead times are an essential metric for two reasons. First, they flag problems involving developers and other parties. Second, they help team leaders improve estimates with long-term averages rather than just looking at the last sprint. The result is more accurate estimates that aren't unreasonably high bars to clear for the team.
Other KPIs to Keep in Mind
Burndown charts, development velocity, and cycle times are three essential KPIs for software engineers and project leaders to use to stay on track, but they are just three of many metrics that development teams should track. Beyond keeping development efforts on track, KPIs can help measure everything from customer satisfaction to defects at the requirements level.
Some of these other agile KPI examples to track include:
- Net Promoter Score (NPS): The Net Promoter Score measures how willing customers are to recommend you to others. It's an excellent way to determine if you're delivering value to customers.
- Escape Defect Rate: The Escape Defect Rate measures the number of bugs that reach production. Of course, lower defect rates translate to higher-quality software.
- Team Happiness Survey: Team Happiness Survey is a simple survey of developer happiness. The idea is to determine when the team might be reaching burnout and need less of a push.
- Planned to Done Ratio: The Planned to Done Ratio tracks the number of backlog items committed to and completed each sprint. Consistently missing goals translates to poor team predictability.
Of course, there are hundreds of different KPIs that different teams and managers use to assess performance, customer satisfaction, and other outcomes. The right metrics to track depend on each team's goals, development processes, stakeholder concerns, and other factors.
How to Stay on Track
Agile development is all about continuously delivering software that meets or exceeds customer expectations. When delivery schedules fall behind, or quality is at risk, team leaders may need to use retrospectives and other techniques to determine why and fix the problem. However, in some cases, there may be an unsolvable problem.
In some cases, you may need extra hands to keep a project on track. For instance, a developer may unexpectedly become sick or need to take family leave. Team augmentation is an excellent way to fill in these gaps and keep projects on track without permanently hiring new developers that require a lot of time to onboard and maybe overkill long-term.
Sharkbyte provides team augmentation services with senior-level developers. In addition to filling in personnel gaps, our developers can help bring ultra-specific expertise to ensure a project reaches its full potential. Our developers are also aware of business outcomes and work to enhance long-term value. Contact us to learn more!
The Bottom Line
Development KPIs are essential tools for team leaders to ensure that everything is on track and running properly. For example, Burndown charts can help show progress during a sprint, development velocity illustrates overall capabilities, and lead times can help average performance over time. All of these efforts can help improve estimates.
If you're interested in augmenting your team or outsourcing parts of your projects, contact us for a free consultation.


