
Struggling with bugs in complex software systems? This guide outlines effective strategies for debugging complex software systems. Learn to use advanced tools, analyze logs, and apply techniques like rubber duck debugging and binary search. Equip yourself with the right methods to solve issues efficiently and enhance your code quality.
Understanding the Debugging Process
Debugging is more than just fixing errors; it’s a systematic process of identifying, analyzing, and resolving defects in code. At its core, debugging is a problem-solving exercise that requires a strategic approach.
The debugging process generally consists of six stages:
- Reproducing the conditions
- Identifying the bug
- Analyzing the root cause
- Fixing the bug
- Testing to confirm the fix
- Documenting the process
A systematic approach emphasizes identifying where the bug is rather than what the bug is, making it easier to trace the symptom back to its root cause.
Replicating the conditions under which a bug occurs helps in accurately diagnosing the problem. Post-fix testing, including unit and integration tests, verifies the solution’s effectiveness. Recording the debugging process gives valuable insights for future reference, making it an essential part of a developer’s toolkit.
Reproducing the Issue Consistently
Consistently reproducing an issue is fundamental for effective debugging, helping to identify the root cause and simplify the fix. Tools like Chrome Developer Tools and Firefox Developer Tools assist in reproducing browser-based issues, providing a reliable environment to reproduce the issue.
Hidden bugs are often triggered by external factors or environment changes, making them elusive. Users typically describe only the symptoms when reporting bugs, which can serve as crucial clues for reproduction. Disruptions like network throttling or slow-motion modes can expose elusive bugs and lead to unexpected behavior, providing a clearer picture of the issue.
Utilizing Advanced Debugging Tools

Advanced debugging tools are a lifeline for software developers navigating complex systems. Interactive debuggers allow you to set breakpoints and modify variables in real-time, offering a hands-on approach to understanding your code’s behavior. For instance, built in debuggers like Chrome DevTools are indispensable for front-end developers, enabling real-time web page inspection and JavaScript debugging.
Visual Studio Code’s built-in debugger supports multiple programming languages and offers debugging in remote environments, making it a versatile tool in your debugging toolkit. Postman, on the other hand, is a valuable resource for API debugging, allowing users to create and inspect HTTP requests and responses.
Remote debugging tools connect to running applications to debug production issues, offering deeper insights into live environments.
Leveraging Log Analysis for Deeper Insights
For larger java applications, log analysis helps identify elusive bugs and performance problems that are hard to reproduce locally. It can provide deeper insights and pinpoint various performance issues, including memory leaks and incorrect variable values. Additionally, it allows developers to inspect variables effectively.
Tools like ELK Stack, Blackfire, and Graylog enhance observation and troubleshooting, making log analysis a powerful addition to your debugging strategies. Structured logs significantly improve the ability to identify issues during automated test failures, providing deeper insights and enhancing debugging efficiency.
Implementing Rubber Duck Debugging
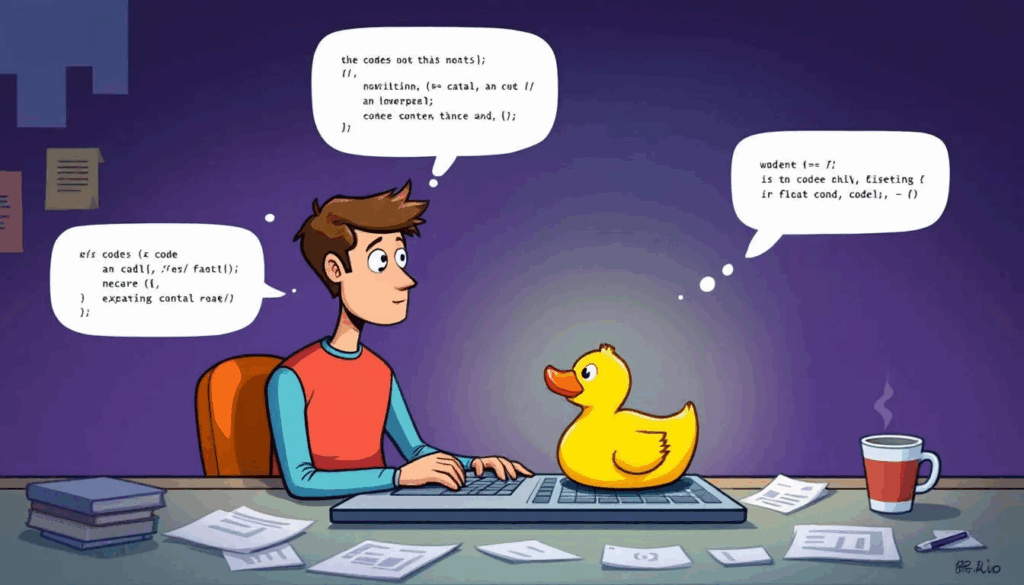
Rubber duck debugging, a simple yet effective technique, can transform your debugging process. The term ‘Rubber Ducking’ originated from developers carrying a rubber duck, an inanimate object, to help explain their code, a concept popularized by the book ‘The Pragmatic Programmer’.
This method forces you to slow down, think over your code, and articulate the problem, highlighting nuances that might be overlooked. By explaining your code line-by-line to a rubber duck, you clarify your understanding of the code logic, revealing errors and reinforcing your debugging strategies.
Binary Search Debugging Method
The binary search debugging method systematically narrows down code sections. It involves eliminating halves of the code systematically to isolate the bug, significantly reducing guesswork.
You can apply binary search principles to an entire codebase by querying sections to find the bug. Git bisect is a practical tool that employs these principles, automating the process of finding the commit that introduced a bug, making your debugging sessions more efficient.
Using Breakpoints and Stepping Techniques
Breakpoints pause code execution at specific lines, allowing real-time inspection of variables and the application’s state. Entering break mode suspends the app’s execution, providing a snapshot of functions and variables still in memory, which is invaluable for debugging. Conditional breakpoints can also be utilized to enhance this process.
Code stepping executes running code one statement at a time, facilitating the observation of execution flow and statement effects. Key commands include:
- Step Into: Allows you to navigate into nested functions to observe their execution.
- Step Over: Lets you execute nested functions without stepping inside them.
- Run to Cursor: Runs the code directly to a specific line.
- Setting a Temporary Breakpoint: Enables running directly to a specific function or line, refining debugging techniques.
Clustering Bugs for Efficient Resolution
Clustering bugs based on their symptoms allows developers to address multiple related issues simultaneously, reducing the complexity of debugging. Focusing on symptoms that occur together helps identify common root causes, leading to faster resolutions and improved software stability.
Resolving clustered bugs enhances system reliability, provides a smoother user experience, and reduces maintenance efforts, making it an essential debugging strategy.
Taking Regular Breaks for Fresh Perspectives
Taking breaks during debugging maintains focus and prevents burnout. Take breaks allow the brain to switch from a focused state to a more creative, big-picture perspective, where creativity often peaks, helping to reduce stress.
Incorporating enjoyable activities during breaks can help clear the mind, enhancing problem solving skills and providing new insights. This fresh perspective can be the key to unlocking solutions to stubborn bugs, making breaks a step forward in your work environment to solve problems, save time, and gain new perspectives while understanding the inner workings of your thought process.
Version Control Reversion Strategies
Version control systems assist in software engineering by tracking changes, enabling developers to revert to previous states and collaborate effectively. Tools like git bisect automate finding the commit that introduced a bug, streamlining the debugging process and making it more efficient.
Maintaining a complete history of code changes with version control systems facilitates easy rollback to previous versions, isolating changes and reducing the risk of introducing new issues, thus improving your debugging strategies.
Automated Testing to Catch Issues Early

Automated testing:
- Prevents bugs and optimizes the debugging process, ensuring higher code quality.
- Provides constant feedback through continuous testing with automated tools.
- Enables faster bug resolution.
- Enhances development efficiency.
Logging techniques, such as structured logging and centralized log aggregation, support proactive issue detection and reduce debugging time. AI tools enhance testing by quickly identifying potential bugs, documenting steps, and aiding in consistent issue reproduction.
Learning from Debugging Sessions
Documenting debugging experiences fosters a learning opportunity, helping experienced developers refine their skills over time. Recording the context and findings from a debugging session builds a valuable knowledge base for future reference, revealing patterns in frequently arising issues.
This practice fosters better collaboration within teams, as explaining code can lead to shared insights and solutions. Reviewing past debugging documentation helps recognize effective solutions for new challenges, enhancing your debugging strategies.
Integrating AI Assistants in Debugging
AI assistants contribute to the debugging process by suggesting code fixes and providing alternative solutions, making them integral to modern debugging methods. AI-driven tools like Graphite Agent provide immediate, actionable feedback on pull requests, streamlining debugging sessions.
Conversational AI tools allow developers to describe issues in natural language and receive detailed explanations, bridging the gap between human intuition and machine efficiency, enhancing your debugging toolkit.
Contacting Support for Expert Guidance
For complex issues, reaching out to support teams is vital to obtain expert solutions. When facing poorly documented features or unresolved bugs, contacting support teams ensures access to necessary expertise, making it a crucial part of effective debugging.
Final thoughts
Debugging is an intricate and essential part of software development. By understanding the systematic process, utilizing advanced tools, and incorporating innovative techniques like rubber duck debugging and AI assistants, you can significantly enhance your code quality.
Remember, effective debugging is not just about finding and fixing bugs; it’s about continuously learning and improving your strategies. So, embrace these techniques, document your sessions, and never hesitate to seek expert guidance. Your journey to mastering debugging starts now!